Image Details
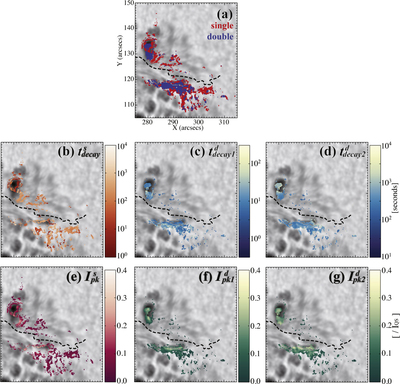
Caption: Figure 6.
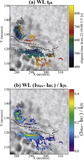
Maps of intensity and temporal evolutions of WL emission. (a) Pixels that are better fit to the single component (red) and to double components (blue). (b) Decay time of WL of single component tdecays (colored dots). (c) Decay time of WL of shorter timescales in double components ﹩{t}_{\mathrm{decay}1}^{d}﹩ (colored dots). (d) Decay time of WL of longer timescales in double components ﹩{t}_{\mathrm{decay}2}^{d}﹩ (colored dots). (e) Peak intensity Ipks of single component (colored dots). (f) Peak intensity ﹩{I}_{\mathrm{pk}1}^{d}﹩ of shorter decay time in double components (colored dots). (g) Peak intensity ﹩{I}_{\mathrm{pk}2}^{d}﹩ of longer decay time in double components (colored dots). The grayscale background is the WL intensity map in the preflare at 22:10:00 UT. The thick, black dotted curve shows the magnetic neutral line.
Other Images in This Article
Copyright and Terms & Conditions
© 2016. The American Astronomical Society. All rights reserved.