Image Details
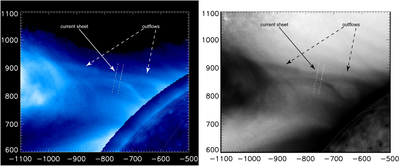
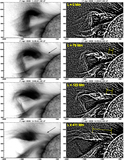
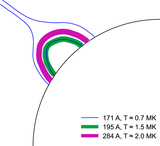
Caption: Figure 7.
Current sheet and reconnection outflows. Left: normal image (bright corresponds to high intensities, dark to low). We artificially lowered the solar disk intensity to make the current sheet more distinguishable. Right: negative image (dark corresponds to high intensities, bright to low). Image was taken on April 17 at 12:38 UT. The dashed lines designate the position of the artificial slit. Coordinates are measured in arcseconds.
Other Images in This Article
Show More
Copyright and Terms & Conditions
© 2016. The American Astronomical Society. All rights reserved.
Copyright ©
2025 Astronomy Image Explorer. All Rights Reserved.