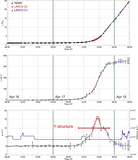
Image Details
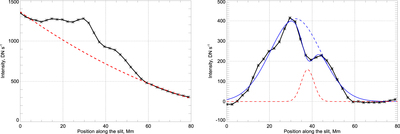
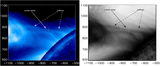
Caption: Figure 10.
Left: scanning of the Y-structure intensity. Black line indicates the intensity across the slit, red dashed line indicates background fit. Right: determination of the Y-structure thickness. Black line: intensity scan after background subtraction; dotted blue line: “main” Gaussian profile; dotted red line: Y-structure Gaussian profile; blue line: intensity fit (difference between the “main” and the Y-structure Gaussian profiles).
Other Images in This Article
Show More
Copyright and Terms & Conditions
© 2016. The American Astronomical Society. All rights reserved.
Copyright ©
2025 Astronomy Image Explorer. All Rights Reserved.