Image Details
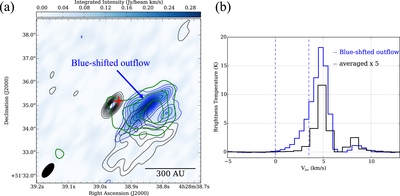
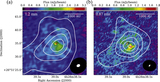
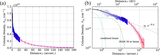
Caption: Figure 7.
Distribution of blueshifted outflow from the Spitzer source. (a) The blue color scale image and blue contours show images of velocity-integrated intensity of 12CO (J = 3–2) with a velocity range of 0.0–4.0 km−1. The lowest contour and subsequent contour step are 0.03 Jy beam−1 km s−1. Black contours show the image of 0.87 mm dust continuum emission, as in Figure 1. The angular resolution of the 12CO (J = 3–2) is given by the black ellipse in the lower left corner of the bottom left panel, 0.″73 × 0.″33. The red plus sign represents the position of the Spitzer source. Green contours show images of velocity-integrated intensity of HCO+ (J = 3–2) with a range of 0.0–4.0 km−1. (b) Blue and black profiles show averaged spectra over the regions inside the blue lowest contour and a circle with a radius of 9.″0 at the center position of (﹩{\alpha }_{J2000.0}﹩, ﹩{\delta }_{J2000.0}﹩) = (4h28m38.ˢ80, +26°51′38.″3), respectively. The blue dashed line shows the velocity range for blue contours in panel (a).
Other Images in This Article
Copyright and Terms & Conditions
© 2016. The American Astronomical Society. All rights reserved.