Image Details
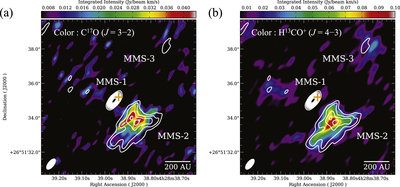
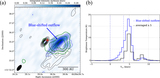
Caption: Figure 1.
Gas/dust distributions of the high-density condensations of MC27/L1521F in Band 7 obtained by the 12 m array alone. (a) Total velocity-integrated intensities of C17O (J = 3–2) are shown in color scale. (b) Total velocity-integrated intensities of H13CO+ (J = 4–3) are shown in color scale. White contours represent the image of the 0.87 mm dust continuum emission in both (a) and (b). The lowest contour and subsequent contour step are 3σ and 2σ; 1σ ∼ 0.1 mJy beam−1. The angular resolutions are given by the ellipses in the lower left corners in each panel, 0.″73 × 0.″34. Orange crosses in each panel represent the position of the Spitzer source.
Other Images in This Article
Copyright and Terms & Conditions
© 2016. The American Astronomical Society. All rights reserved.