Image Details
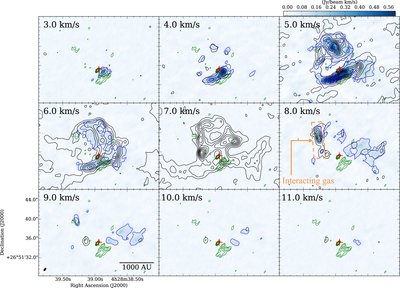
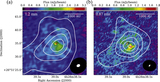
Caption: Figure 6.
Velocity-channel maps of the 12CO (J = 3–2) and HCO+ (J = 3–2) emission toward MC27/L1521F. Blue color scale and blue contours show velocity-range-integrated intensity maps of 12CO (J = 3–2) data. Black contours show those of HCO+ (J = 3–2) data (Tokuda et al. 2014). The lowest contour and subsequent step of the blue contours are 0.05 and 0.2 Jy beam−1 km s−1, respectively. The lowest contour and subsequent contour step of the black contours are 0.02 and 0.04 Jy beam−1 km s−1, respectively. The velocity span for each map is 1.0 km s−1. The lowest velocities are given in the upper left corner of each panel. Green contours show the image of 0.87 mm dust continuum emission, as in Figure 1. The angular resolution of the 12CO (J = 3–2) is given by the white ellipse in the lower left corner of the bottom left panel, 0.″73 × 0.″33. Red plus signs of each panel represent the position of the Spitzer source. The dashed orange rectangle in panel of the 8.0 km s−1 shows interacting gas with a compact outflow, discussed by Tokuda et al. (2014).
Other Images in This Article
Copyright and Terms & Conditions
© 2016. The American Astronomical Society. All rights reserved.