Image Details
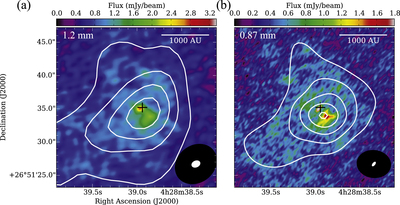
Caption: Figure 4.
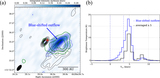
Distributions of dust continuum emission toward MC27/L1521F. (a) Color scale image shows 1.2 mm dust continuum image combining the ALMA data (the 12 m array + the 7 m array) with IRAM 30 m data, as in Figure 3(b). White contours illustrate 1.2 mm dust continuum emission taken by the 7 m array alone, as in Figure 2(a). The angular resolutions of the combined image and the 7 m array alone are given by white and black ellipses, respectively, in the lower right corner. (b) The color scale image shows the 0.87 mm dust continuum image combining the ALMA data (the 12 m array + the 7 m array) with JCMT/SCUBA data (Shinnaga et al. 2004; Kirk et al. 2005). White contours illustrate 0.87 mm dust continuum emission taken by the 7 m array alone. The contours start at three times the noise level and increase at this interval; the noise levels of the 7 m array data alone are 2.4 mJy beam−1. The angular resolutions of the combined image and the 7 m array alone are given by white and black ellipses, respectively, in the lower right corner. Black crosses in each panel represent the position of the Spitzer source.
Other Images in This Article
Copyright and Terms & Conditions
© 2016. The American Astronomical Society. All rights reserved.