Image Details
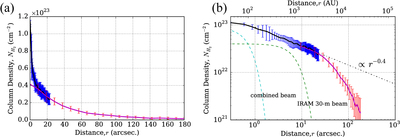
Caption: Figure 5.
Mean radial profile of H2 column density centered at the MMS-2 peak in MC27/L1521F made from the 1.2 mm dust continuum image obtained by the IRAM 30 m telescope alone and the combined ALMA data (the 12 m array + the 7 m array) with the IRAM 30 m data. Panels (a) and (b) show the linear–linear plot and the log–log plot of the profiles, respectively. The averaged profiles of the combined data and the IRAM data are shown by black and magenta solid lines, respectively. Blue and red bars show the (±1σ) dispersion of the distribution of radial profiles in each data. The dot-dashed line in panel (b) denotes pure power-law distributions of ﹩{r}^{-0.4}﹩. Dotted curves in green and cyan in panel (b) indicate the beam shape of the IRAM 30 m telescope image and the combined image, a Gaussian function with FWHM of 14″ and 1.″1, respectively.
Other Images in This Article
Copyright and Terms & Conditions
© 2016. The American Astronomical Society. All rights reserved.