Image Details
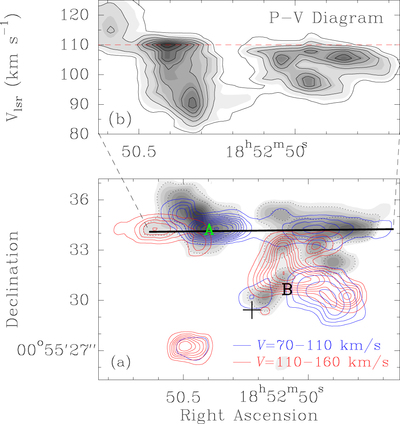
Caption: Figure 6.
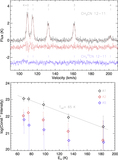
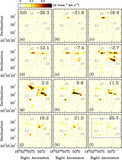
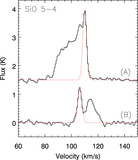
(a) Emission distribution of the red and blueshifted components of the SiO 5–4 transition. The integrated velocity ranges are indicated in the panel. Both red and blue contour levels start from 2 K km s−1 and increase by 3 K km s−1. The gray background overlapping with the red and blue contours is the distribution of the narrow component, shown with red lines in Figure 7. The dotted contours indicate the intensity levels of 2 and 5 K km s−1 of the narrow component. The cross sign indicates the peak emission position of the H30α line. The letters A and B are the positions where sample spectra are shown in Figure 7. (b) Position–velocity diagram along the thick black line in panel (a). The contour lines are for 0.2, 0.5, 0.8, 1.1,… K.
Other Images in This Article
Copyright and Terms & Conditions
© 2016. The American Astronomical Society. All rights reserved.