Image Details
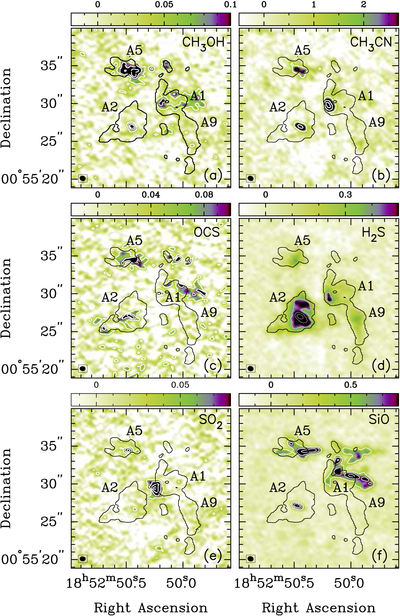
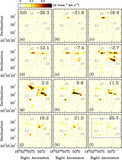
Caption: Figure 2.
Integrated intensity maps of the observed transitions: (a) CH3OH, (b) CH3CN (all K transitions together), (c) OCS, (d) H2S, (e) SO2, and (f) SiO. Intensity scales of the false color (in units of Jy beam−1 km s−1) are shown above each panel. White contour lines have been included in the panels for clarity in addition to the false color image. Contour levels (in unit of Jy beam−1 km s−1) are: 0.05, 0.1, and 0.15 for (a), 1.5, 4.5, and 7.5 for (b), 0.05, 0.1, and 0.15 for (c), 0.4, 0.6 and 0.8 for (d), 0.04, 0.08, 0.12, and 0.16 for (e), and 0.4, 0.8, and 1.2 for (f). Beams are shown in the bottom left corners. The black contour is the outline of the 13CS 5–4 emission in Figure 1.
Other Images in This Article
Copyright and Terms & Conditions
© 2016. The American Astronomical Society. All rights reserved.