Image Details
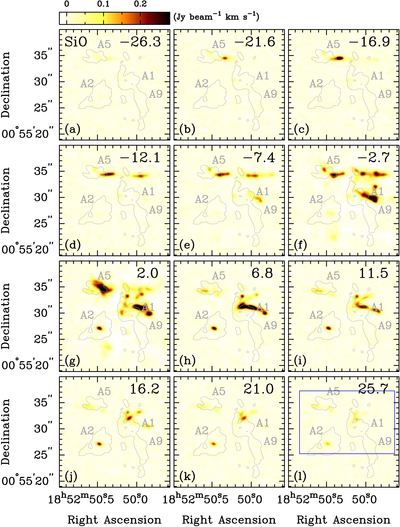
Caption: Figure 5.
Velocity channel maps of the SiO 5–4 transition emission, integrated over the velocity width of about 4.7 km s−1. The center velocities relative to the systemic velocity of 107.6 km s−1 are listed in the upper right corner of each panel. The intensity scale is shown as a bar above panel (a). The gray contour is the outline of the 13CS 5–4 emission in Figure 1. The blue box in panel (l) is the area shown in Figure 6.
Other Images in This Article
Copyright and Terms & Conditions
© 2016. The American Astronomical Society. All rights reserved.
Copyright ©
2025 Astronomy Image Explorer. All Rights Reserved.