Image Details
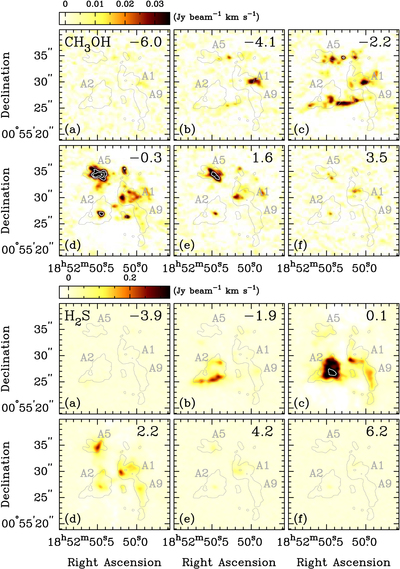
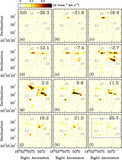
Caption: Figure 3.
Velocity channel maps of the observed CH3OH ﹩{5}_{\mathrm{1,4}}\mbox{--}{4}_{\mathrm{2,2}}﹩ E and H2S ﹩{2}_{\mathrm{2,0}}\mbox{--}{2}_{\mathrm{1,1}}﹩ transitions. Center velocities of the channel relative to the systemic velocity of 107.6 km s−1 are listed in the upper right corner of each panel. The intensity scales are shown in the bar above the panel (a). For clarity, the white contours are included in addition to the false color images. Contour levels are 0.04, 0.06, and 0.08 Jy beam−1 km s−1 for CH3OH, and 0.4 Jy beam−1 km s−1 for H2S. The gray contour is the outline of the 13CS 5–4 emission in Figure 1.
Other Images in This Article
Copyright and Terms & Conditions
© 2016. The American Astronomical Society. All rights reserved.