Image Details
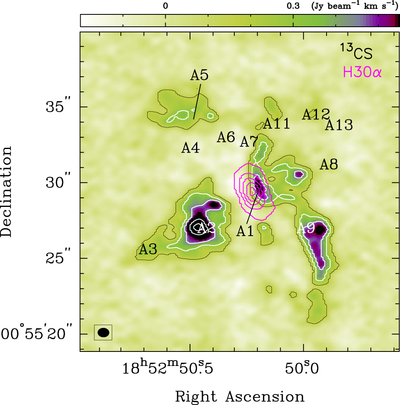
Caption: Figure 1.
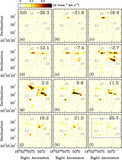
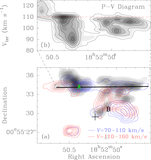
Integrated intensity map of the 13CS 5–4 transition with colored scale, shown as a bar above the figure. The boundary contour in black is for the 0.15 Jy beam−1 km s−1 intensity, and the white contours are for the 0.15 × [3, 5, 7] Jy beam−1 km s−1 intensities. The magenta contour lines show the H30α line with a scale of 0.5 × [1, 2, 3, 4, 5] Jy beam−1 km s−1. The labels A1–A13 are the positions of the dust continuum peaks identified by Liu et al. (2015). The beam of 0.″75 × 0.″60 (﹩\mathrm{PA}=88^\circ ﹩) is shown in the bottom left corner.
Other Images in This Article
Copyright and Terms & Conditions
© 2016. The American Astronomical Society. All rights reserved.
Copyright ©
2025 Astronomy Image Explorer. All Rights Reserved.