Image Details
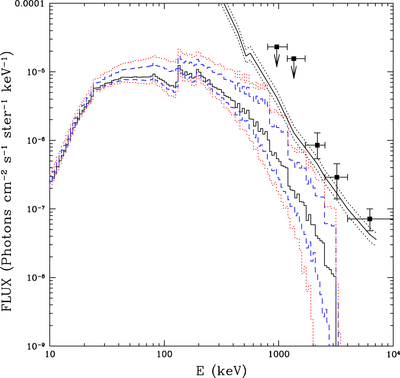
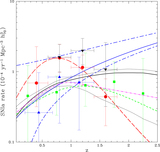
Caption: Figure 9.
Gamma-ray background using the Okumura et al. (2014) fit to the observed SN Ia rates (black solid line), together with its ±1σ bounds (blue dashed lines) and ±2σ bounds (red lines). The ±1σ and ±2σ bounds have been traced by calculating the total error in the rates from the statistical and systematic errors of the points measured by these authors. The upper systematic errors include 50% extinction by dust. The model used is the fully mixed W7fm (W99b), but predictions for the models W7, W7dt, N100, and the two models of the violent merging of a couple of WDs are qualitative similar.
Other Images in This Article


Show More
Copyright and Terms & Conditions
© 2016. The American Astronomical Society. All rights reserved.
Copyright ©
2025 Astronomy Image Explorer. All Rights Reserved.