Image Details
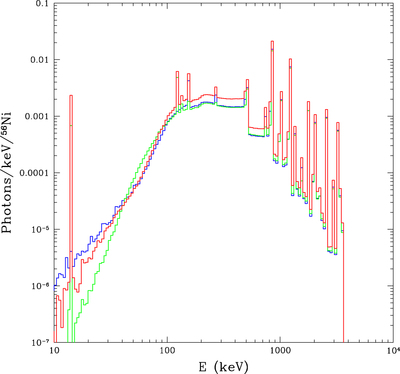
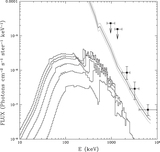
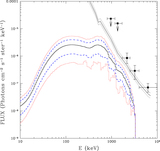
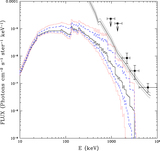
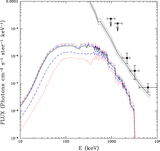
Caption: Figure 1.
Total X-ray continuum and gamma-ray line fluxes per 56Ni nuclei, integrated over the first 600 days. The green line shows the corresponding fluxes from the calculations of The et al. (1993) for the W7 model (Nomoto et al. 1984), the blue line shows the fluxes for the fully mixed W7 model (W7fm) used in W99b, and the red line shows the fluxes for the W7dt model from Yamaoka et al. (1992; see also The & Burrows 2014).
Other Images in This Article


Show More
Copyright and Terms & Conditions
© 2016. The American Astronomical Society. All rights reserved.
Copyright ©
2025 Astronomy Image Explorer. All Rights Reserved.