Image Details
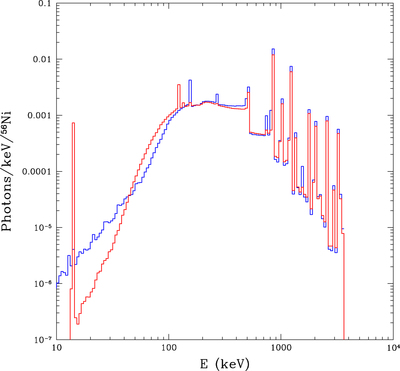
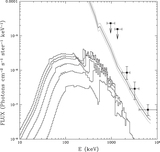
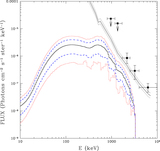
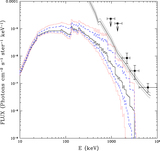
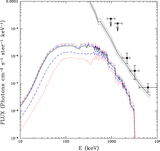
Caption: Figure 3.
Total time-integrated X-ray continuum and gamma-ray line fluxes per 56Ni nucleus, comparing the calculations for an average model of the sub-Chandrasekhar pure detonation models (Sim et al. 2010; Ruiter et al. 2013; red line) and for the W7fm model of W99b (blue line).
Other Images in This Article


Show More
Copyright and Terms & Conditions
© 2016. The American Astronomical Society. All rights reserved.
Copyright ©
2025 Astronomy Image Explorer. All Rights Reserved.