Image Details
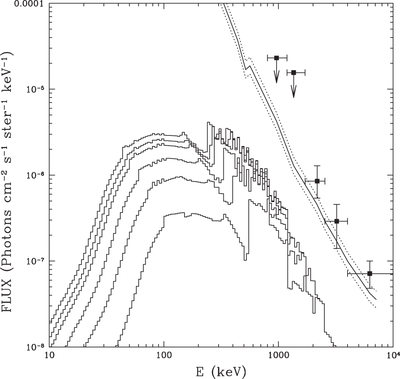
Caption: Figure 7.
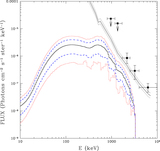
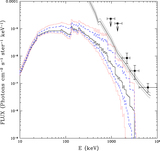
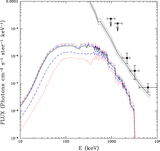
Contributions to the gamma-ray background when considering the mean value fit to the SN Ia rates from Subaru-XMM (Okumura et al. 2014), for redshifts up to z = 0.50, 1.00, 1.50, 2.00, 2.25, and 2.50 (curves in the order of increasing backgrounds at energy E around 100 keV correspond to the also increasing values of z), for model W7fm. One can see that, after z = 2, the additional contribution becomes very small. Here and in the next three figures, the black squares correspond to the COMPTEL data, analyzed by Kappadath et al. (1996), while the solid line gives the results from the Solar Maximum Mission (Watanabe et al. 1999b), the dotted lines being the 1σ upper and lower limits.
Other Images in This Article


Show More
Copyright and Terms & Conditions
© 2016. The American Astronomical Society. All rights reserved.