Image Details
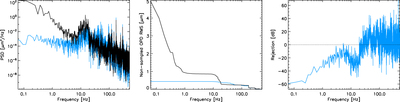
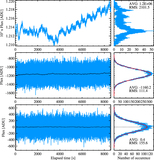
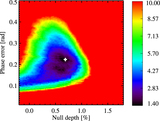
Caption: Figure 15.
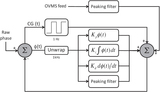
Left: power spectral densities of the differential OPD variations between the two AO-corrected LBT apertures in closed loop (blue line) and open loop (black line). Middle, corresponding reverse cumulative OPD variations showing the improvement in stability over 20 s from 5 μm rms in open loop to ∼400 nm rms in closed loop. Right: corresponding frequency response. Data obtained on 2015 February 4 on the bright star μ Gem. Loop gains were Kp = 1, Ki = 300, and Kd = 0.
Other Images in This Article

Show More
Copyright and Terms & Conditions
© 2016. The American Astronomical Society. All rights reserved.
Copyright ©
2025 Astronomy Image Explorer. All Rights Reserved.