Image Details
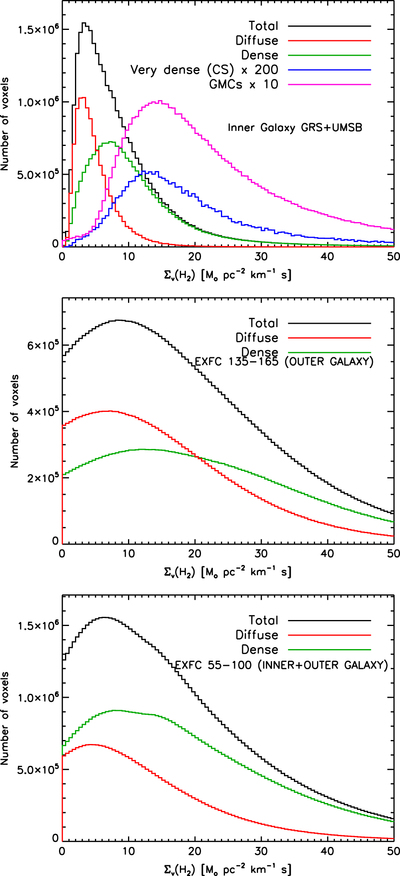
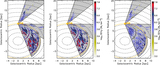
Caption: Figure 8.
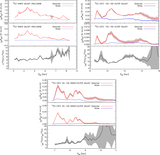
Distribution of the H2 spectral surface density in each voxel (surface density along the line of sight per unit velocity, expressed in M⊙ pc−2 (km s−1)−1) in each survey. The top panel corresponds to the inner Galaxy with the GRS+USMB surveys. The middle panel includes data from the EXFC 135–165 survey (outer Galaxy), and the bottom panels shows data from the EXFC 55–100 survey (inner and outer Galaxy). The diffuse (detected in 12CO, undetected in 13CO), dense (detected in 12CO and 13CO), and very dense (detected in 12CO, 13CO, and CS, inner Galaxy only) components are indicated by red, green, and blue lines, respectively. The black line corresponds to the total contribution of these three components. The distribution of spectral surface densities in voxels located within giant molecular clouds identified in the GRS by Roman-Duval et al. (2010) is shown in magenta. In the inner Galaxy, the field where CS observations were obtained only covered 2 deg2, and therefore corresponds to a number of voxels too small to be seen in the histogram. We thus plot the number of voxels in this “very dense” category multiplied by ∼200 so that it can be clearly seen in the histogram plots.
Other Images in This Article

Show More
Copyright and Terms & Conditions
© 2016. The American Astronomical Society. All rights reserved.