Image Details
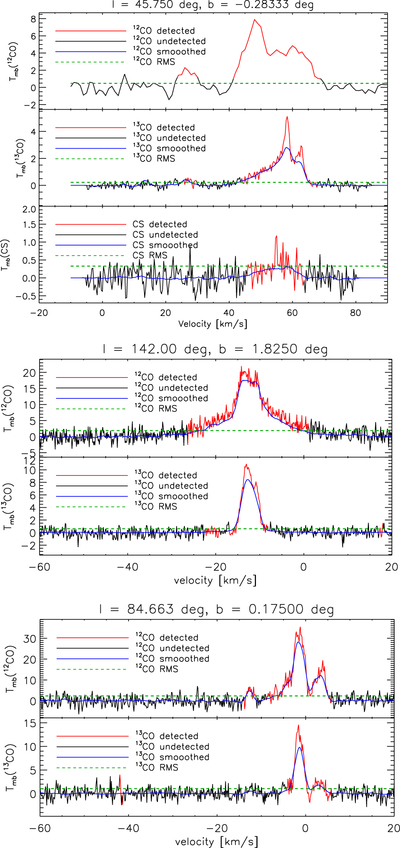
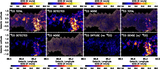
Caption: Figure 1.
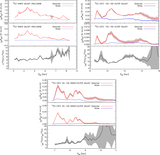
Example of separation of voxels in the “noise” and “detection” categories in a sight-line of the GRS+UMSB surveys (top), in the EXFC 135–165 survey (middle), and in the EXFC 55–100 survey (bottom). The 12CO and 13COspectra are shown in the top two panels. For the GRS+UMSB only, the bottom panel shows the CS spectrum. The procedure described in Section 3.2 is used to compute the detection masks. The black and red lines indicate noise in the 12CO line and detected 12CO emission, respectively. The blue curves correspond to the smoothed spectra. The dashed green line indicates the rms main beam temperature of the un-smoothed spectra.
Other Images in This Article

Show More
Copyright and Terms & Conditions
© 2016. The American Astronomical Society. All rights reserved.