Image Details
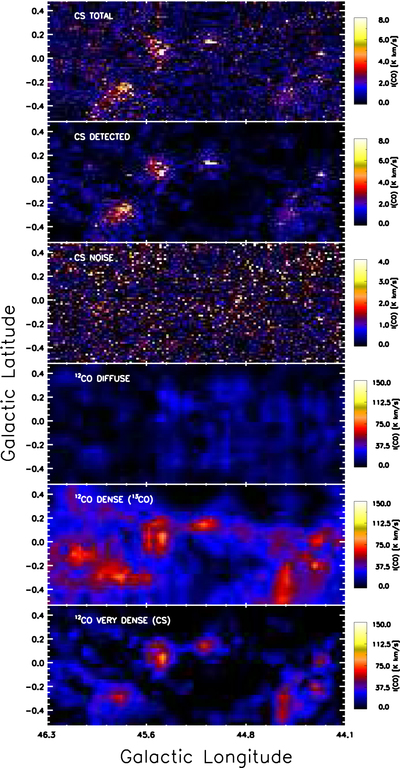
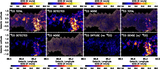
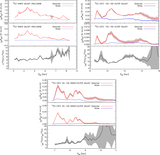
Caption: Figure 4.
From top to bottom, in the two-square-degree field of the GRS where CS is observed, integrated intensity maps of the total (noise+detection) CS emission, of the detected CS emission, of the noise in the CS cubes, of the diffuse (12CO-bright and 13CO-dark), dense (12CO-bright, 13CO-bright, and CS-dark), and very dense (12CO-bright, 13CO-bright, and CS-bright) 12CO components.
Other Images in This Article

Show More
Copyright and Terms & Conditions
© 2016. The American Astronomical Society. All rights reserved.
Copyright ©
2025 Astronomy Image Explorer. All Rights Reserved.