Image Details
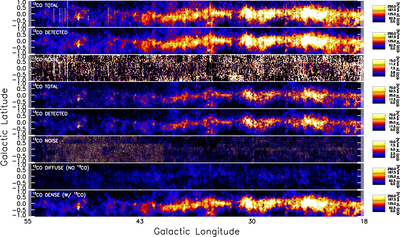
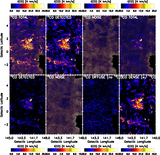
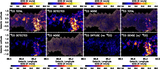
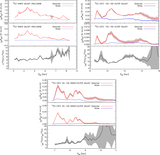
Caption: Figure 3.
From top to bottom, in the GRS+UMSB, integrated intensity maps of total 12CO emission (noise + detection), of the “detected” 12CO emission, of the “noise” in the 12CO cube, of the total 13CO emission, of the detected 13CO emission, of the noise in the 13CO cube, and of the diffuse (12CO-bright and 13CO-dark) and dense (12CO-bright and 13CO-bright) 12CO components.
Other Images in This Article
Show More
Copyright and Terms & Conditions
© 2016. The American Astronomical Society. All rights reserved.
Copyright ©
2025 Astronomy Image Explorer. All Rights Reserved.