Image Details
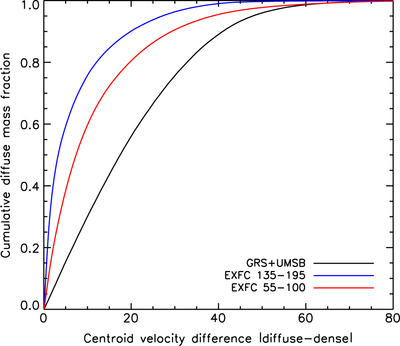
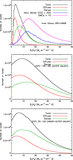
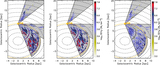
Caption: Figure 17.
Cumulative mass fraction of gas classified as “diffuse” as a function of the centroid velocity difference between the “diffuse” and “dense” gas, calculated in sight-lines where both “diffuse” and “dense” gas components are detected. The black, red, and blue curves correspond to the GRS+UMSB, EXFC 55–100, and EXFC 135–195, respectively.
Other Images in This Article

Show More
Copyright and Terms & Conditions
© 2016. The American Astronomical Society. All rights reserved.
Copyright ©
2025 Astronomy Image Explorer. All Rights Reserved.