Image Details
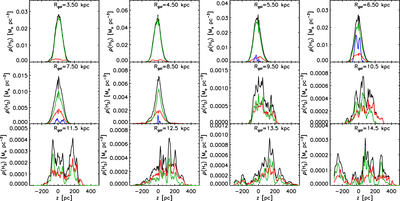
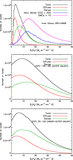
Caption: Figure 15.
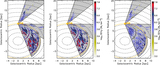
Vertical distribution of molecular gas traced by CO as a function of Galactocentric radius, with the contributions of the diffuse extended (detected in 12CO but not 13CO) and dense (detected in 12CO and 13CO) components in red and green respectively. The vertical distributions are derived with the combined data sets. in the inner Galaxy, the very dense component traced by CS emission is shown in blue. The black lines corresponds to the total profiles.
Other Images in This Article

Show More
Copyright and Terms & Conditions
© 2016. The American Astronomical Society. All rights reserved.
Copyright ©
2025 Astronomy Image Explorer. All Rights Reserved.