Image Details
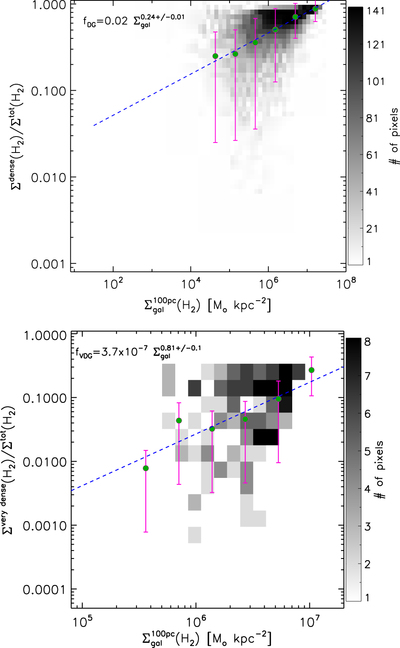
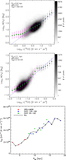
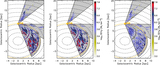
Caption: Figure 14.
Relation between dense (top, detected in 12CO and 13CO) and very dense (bottom, detected in 12CO, 13CO, and CS) molecular gas fraction and average Galactic surface density of molecular gas, derived from the combined data sets. The gray scale indicates the density of points, while the pink/green dots show the binned average. The errors bars correspond to the standard deviation in each bin.
Other Images in This Article

Show More
Copyright and Terms & Conditions
© 2016. The American Astronomical Society. All rights reserved.
Copyright ©
2025 Astronomy Image Explorer. All Rights Reserved.