Image Details
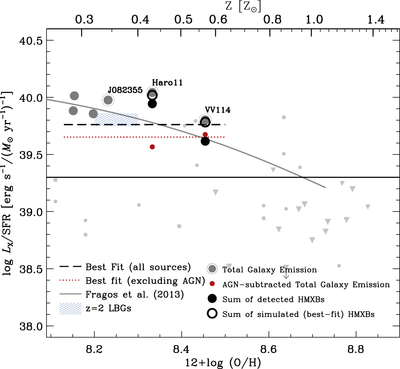
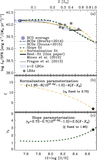
Caption: Figure 8.
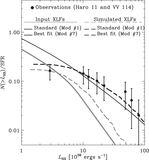
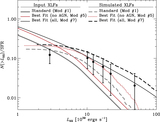
Starting with Figure 2, we now add data based on current analysis of sources within Haro 11 and VV 114. The previous black points (now dark gray) show the global 2–10 keV emission for the galaxies, while the black points show the sum of luminosities from the detected HMXBs within each galaxy. The open black circles mark the sum of luminosities using the luminosity distribution of our best fit (Model# 2), demonstrating that source-blended sources drawn from a flatter XLF distribution than the standard XLF also match the global emission and the Fragos et al. (2013a) prediction. The smaller red points show the effect of removing potential AGN sources from the observed detections. The lines provide the estimate of ﹩{L}_{\mathrm{HX}}﹩/SFR based on integrating the best-fit XLFs down to 1036 erg s−1 for all the sources (black dashed, Section 3.3) and excluding AGN candidates (red dotted, Section 3.4).
Other Images in This Article
Copyright and Terms & Conditions
© 2016. The American Astronomical Society. All rights reserved.