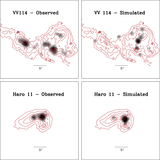
Image Details
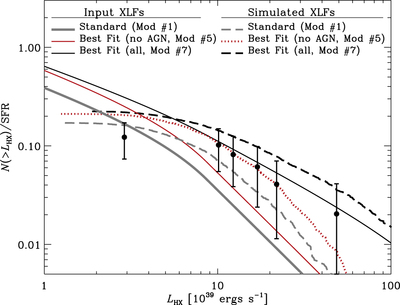
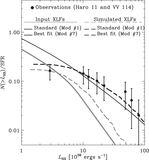
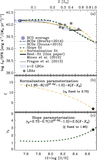
Caption: Figure 7.
Same as bottom panel of Figure 6, except that we have removed any potential AGNs from both the observed points (filled circles) and simulated data (dashed curves). The black dashed line was the previous best fit (Model #7, same as Figure 6), which is no longer the best description, but is a decent representation (second best model, see Table 4). In addition we have added the red dotted line to show the best fit to these data: Model #5 (﹩\xi =2.93﹩ and ﹩{\gamma }_{2}=2.73﹩, same as the standard model); the input XLF is shown as a solid red line. We note that our conservative analysis removed the sources at the bright end and therefore the models are not as well constrained.
Other Images in This Article
Copyright and Terms & Conditions
© 2016. The American Astronomical Society. All rights reserved.