Image Details
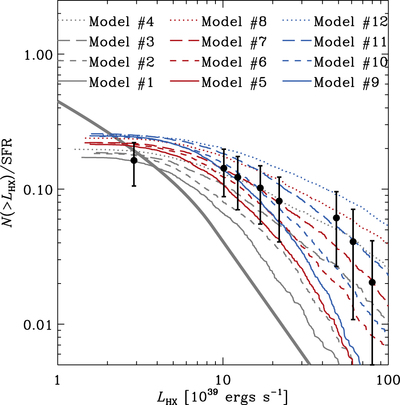
Caption: Figure 6.
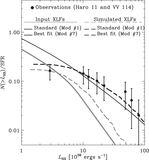
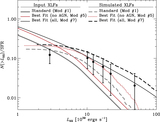
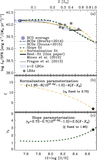
As in Figure 5, the black points show the observed XLF and the thicker gray line shows the input standard XLF (without source blending effects) in both panels. The simulated XLFs are displayed in different colors and line styles to show the effects of varying normalizations and bright-end slopes, respectively. Table 4 provides the parameter values that correspond to the models. Model #1 refers to the standard star-forming galaxy XLF.
Other Images in This Article
Copyright and Terms & Conditions
© 2016. The American Astronomical Society. All rights reserved.
Copyright ©
2026 Astronomy Image Explorer. All Rights Reserved.