Image Details
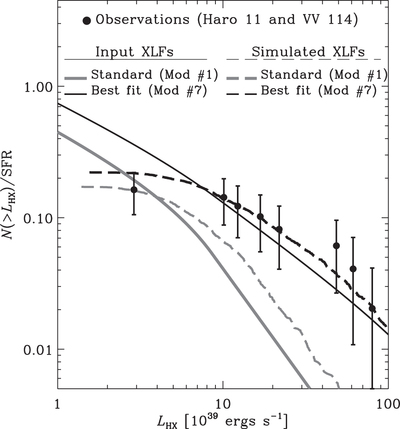
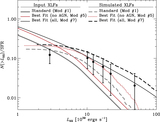
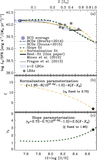
Caption: Figure 5.
We simulate source-blended XLFs (dashed lines) by drawing statistically from the input XLFs (solid lines) and constructing simulated images and XLFs. We show two cases here: gray curves for the standard model (﹩\xi =1.95﹩ and ﹩{\gamma }_{2}=2.73﹩; Mineo et al. 2012) and black curves for our best-fit model (Model # 7: ﹩\xi =2.93﹩, 1.5× higher than the standard model, and ﹩{\gamma }_{2}=1.90﹩) The combined observations for Haro 11 and VV 114 appear as solid points. Based on these simulations, the source-blended standard model is not a good representation of the data and is ruled out at ﹩\gt 99﹩% confidence level by the K-S test.
Other Images in This Article
Copyright and Terms & Conditions
© 2016. The American Astronomical Society. All rights reserved.