Image Details
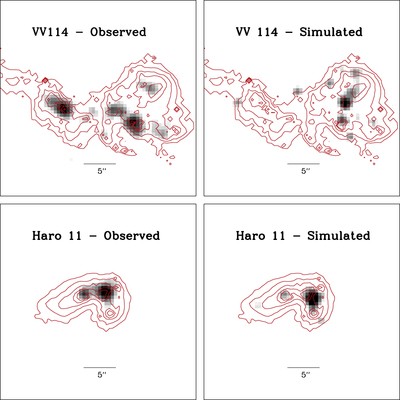
Caption: Figure 4.
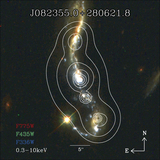
We show the observed Chandra images (left) alongside the MARX output images for the simulations (right), assuming X-ray luminosities distributed like typical star-forming galaxies from Mineo et al. (2012), for VV 114 (top images) and Haro 11 (bottom images). Note that here we show only one realization, however, we run 100 realizations of the simulations for our full analysis. In the simulations, X-ray sources are spatially distributed according to the SFR maps, which are estimated using the HST F814W filter and shown here as red contours.
Other Images in This Article
Copyright and Terms & Conditions
© 2016. The American Astronomical Society. All rights reserved.
Copyright ©
2026 Astronomy Image Explorer. All Rights Reserved.