Image Details
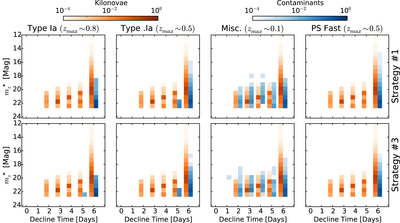
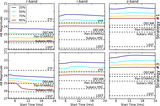
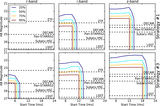
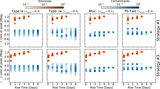
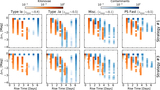
Caption: Figure 17.
Same as Figure 15 but showing the decline time–﹩{m}_{z}^{\star }﹩ slice of the phase space. As in Figure 15, the contaminants are not clearly separated from the kilonovae population in ﹩{m}_{z}^{\star }.﹩ However, as in Figure 16, the long decline times can be used to distinguish kilonovae from the contaminant populations.
Other Images in This Article
Show More
Copyright and Terms & Conditions
© 2015. The American Astronomical Society. All rights reserved.
Copyright ©
2025 Astronomy Image Explorer. All Rights Reserved.