Image Details
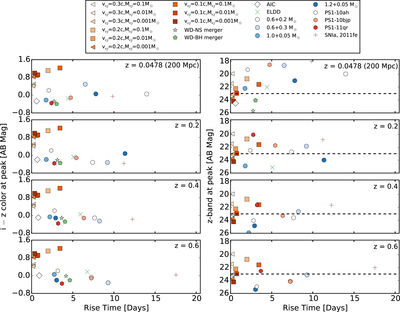
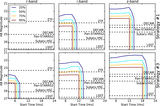
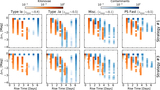
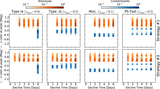
Caption: Figure 3.
Time–color (left) and time–magnitude (right) slices of the time–color–magnitude phase space at a selection of redshifts. Arrow markers denote upper limits on the rise time. Note that in all panels the population of kilonovae is kept at the fiducial distance of ∼200 Mpc while redshift corrections are applied to the contaminant population. Kilonovae are well separated from the contaminant population in both color and timescale. The delineation in magnitude is less apparent. This figure does not include CNe because they are too faint to be relevant background contamination.
Other Images in This Article
Show More
Copyright and Terms & Conditions
© 2015. The American Astronomical Society. All rights reserved.
Copyright ©
2025 Astronomy Image Explorer. All Rights Reserved.