Image Details
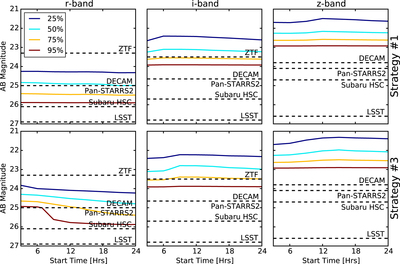
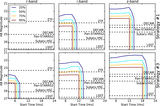
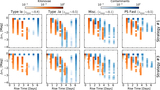
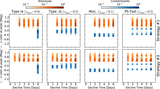
Caption: Figure 4.
Depth vs. start time grid in r (left), i (middle), and z (right) for observing Strategies 1 and 3. The contours indicate the fraction of sources detected in at least three epochs (25% blue, 50% cyan, 75% yellow, 95% red). The dashed lines represent the approximate 5σ limiting magnitudes of several wide-field telescopes assuming the appropriate number of pointings necessary to cover a ∼100 deg2 error region with the required cadence. The choice of observing strategy does not drastically affect the fraction of sources detected at a given depth.
Other Images in This Article
Show More
Copyright and Terms & Conditions
© 2015. The American Astronomical Society. All rights reserved.
Copyright ©
2025 Astronomy Image Explorer. All Rights Reserved.