Image Details
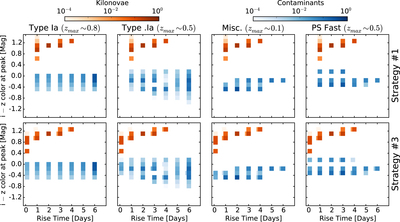
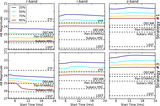
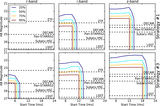
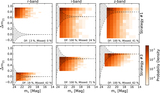
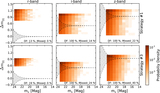
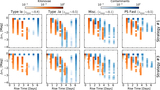
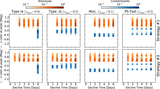
Caption: Figure 8.
Simulated rise time–color phase space for observing Strategies 1 and 3. In each panel, we consider the full grid of kilonova models to a distance of 200 Mpc (orange). Each column highlights a different subset of the contaminant population over the comoving volume to zmax (blue). The offset bins for Strategy 3 are due to the availability of intra-night observations on the first night. We find that the kilonovae are much redder than any potential contaminant, but the separation is less well defined when compared to the light curves used in Section 3.
Other Images in This Article
Show More
Copyright and Terms & Conditions
© 2015. The American Astronomical Society. All rights reserved.
Copyright ©
2025 Astronomy Image Explorer. All Rights Reserved.