Image Details
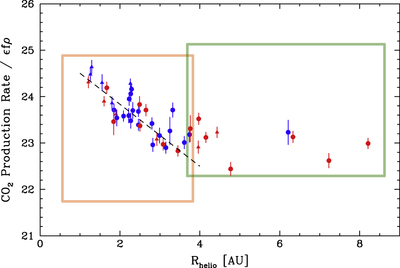
Caption: Figure 9.
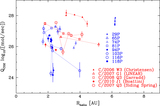
Log (﹩{Q}_{{\mathrm{CO}}_{2}}﹩/ϵfρ) as a function of Rh[AU]. LPCs are represented by red symbols, SPCs blue. Note the two dissimilar groupings of behavior (orange an green boxes) inside and outside 4 AU. The latter may be CO production driven activity, and includes 29P at 6.2 AU, and C/2009 P1 (Garradd) at 6.3 AU.
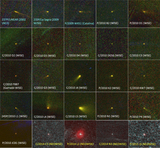
Other Images in This Article


Copyright and Terms & Conditions
© 2015. The American Astronomical Society. All rights reserved.
Copyright ©
2025 Astronomy Image Explorer. All Rights Reserved.