Image Details
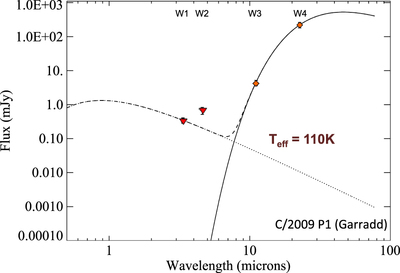
Caption: Figure 3.
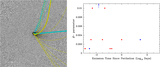
WISE 4.6 μm band (W2) contains CO 4.7 μm and CO2 4.3 μm emission lines. C/2009 P1 Garradd's 4.6 μm band excess is not consistent with reflected or thermal contributions of coma or nucleus, but is consistent with CO2 and CO emission. The flux from the 3.4 μm (left red triangle), 4.6 μm (right red triangle), 12 μm (left orange diamond) and 22 μm (right orange diamond) channels are shown. Also the reflected light model (dotted line) thermal model (solid line) and combined signal (dashed line) are over-plotted.
Other Images in This Article


Copyright and Terms & Conditions
© 2015. The American Astronomical Society. All rights reserved.
Copyright ©
2025 Astronomy Image Explorer. All Rights Reserved.