Image Details
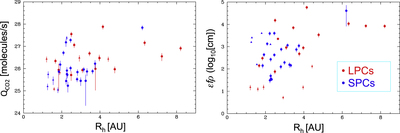
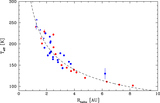
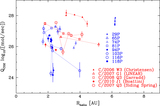
Caption: Figure 8.
(Left) excess flux in 4.6 μm channel converted to CO2 production plotted WRT heliocentric distance. (Right) ϵfρ as a function of heliocentric distance. Note the distributions for LPCs and SPC are similarly scattered.
Other Images in This Article


Copyright and Terms & Conditions
© 2015. The American Astronomical Society. All rights reserved.
Copyright ©
2025 Astronomy Image Explorer. All Rights Reserved.