Image Details
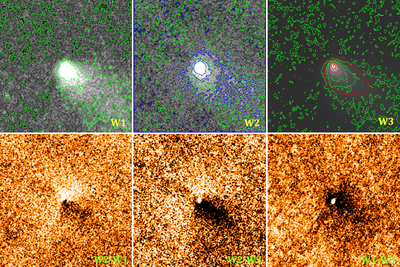
Caption: Figure 2.
Morphological differences for comet C/2007 Q3 (Siding Spring); see Tables 1 and 2 for observation times and distances. The top three panels (left to right) show 3.4 μm image contours (green) overlaid onto W1, W2 (blue contours), and W3 (red contours) band images. The bottom panels show (from left to right) the peak-normalized difference images of W2–W1, W2–W3, and W1–W3. Note the miss-match between shape of the contours of W2 and W3 in the top panels, and the better match between the contours of W1 and W3. Also, note the asymmetries in the difference images for W2 that are not present in the W1–W3 image. W1 and W3 trace the dust, while a more spherical component, likely gas emission, is present in the W2 flux. Note also the point-spread function's width is larger in W3 than in W1 or W2. This is the cause of the brightness peak and more extended dark regions when W3 is subtracted from W1 in the lower right panel.
Other Images in This Article


Copyright and Terms & Conditions
© 2015. The American Astronomical Society. All rights reserved.