Image Details

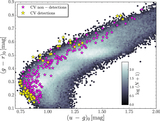
Caption: Figure 7.
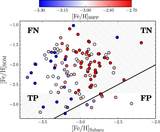
﹩{(u-g)}_{0},﹩ ﹩{(g-r)}_{0}﹩ CC diagram showing the location of stars with large proximity measure. Top: density plot showing the total number of training set stars in each ∼0.01 × 0.01 mag pixel on a white to black color scale. The blue points show training set stars in the 99th percentile of proximity measure, corresponding to ﹩\rho \geqslant 0.3883.﹩ The solid orange line shows the 99.7% contour for the training set, as measured in the ﹩{(u-g)}_{0},﹩ ﹩{(g-r)}_{0}﹩ plane. Bottom: density plot showing the total number of field stars with ﹩\rho \lt 0.3883﹩ pixel−1. The solid orange line shows the same contour as the top panel. Red points show the location of field stars with ﹩\rho \geqslant 0.3883.﹩ The majority of stars outside the main stellar locus have large proximity measure. There are no field stars with ﹩{(g-r)}_{0}\lesssim 0.13,﹩ because the colors-Teff method does not apply to stars with Teff ﹩\;\gt \;7000﹩ K.
Other Images in This Article
Copyright and Terms & Conditions
© 2015. The American Astronomical Society. All rights reserved.