Image Details
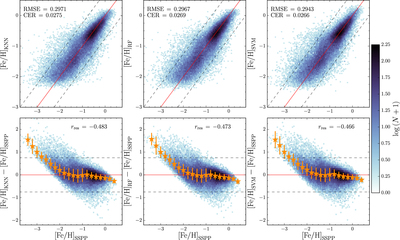
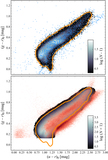
Caption: Figure 2.
Regression results for the optimized KNN, RF, and SVM models shown, respectively, in the three columns from left to right. Top: density plot showing the number of sources in each pixel on the predicted [Fe/H] vs. SSPP [Fe/H] plane. Pixels are ∼0.05 dex on a side. The solid, red line shows the relation for perfect 1:1 regression, while the dashed, gray lines show the boundaries for catastrophic errors, ±0.75 dex. Sources located outside the gray lines are considered catastrophic outliers. The SVM model has the smallest RMSE and CER. Bottom: residuals from the models (shown above), with the density of sources shown in each pixel. The orange stars show the median residual value in bins of width 0.2 dex. The associated error bars show the scatter in each bin: 1.48 × MAD, an outlier-resistant and robust measure of the scatter. ﹩{r}_{\mathrm{res}}﹩ is the Pearson r correlation coefficient for the residuals as a function of [Fe/H]﹩{}_{\mathrm{SSPP}}.﹩ rres values close to zero indicate little bias in the model predictions. The SVM model produces the least biased estimates of [Fe/H].
Other Images in This Article
Copyright and Terms & Conditions
© 2015. The American Astronomical Society. All rights reserved.