Image Details
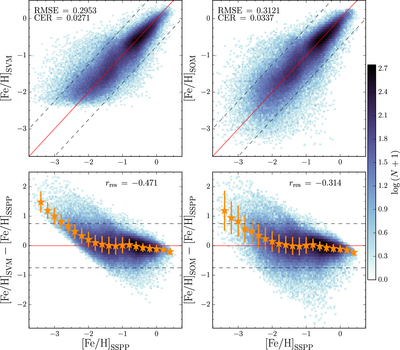
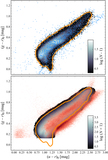
Caption: Figure 4.
10-fold cross-validation results for the full 170,610 star training set for the SVM-regression model (left) and the synthetic-oversampling model with 40× oversampling and no downsampling (right). Top: density plot showing the number of sources in each pixel on the predicted [Fe/H] vs. SSPP [Fe/H] plane. Bottom: residuals from the model, with the density of sources shown in each pixel. The pixel scale, solid and dashed lines, and orange stars in the top and bottom plots are the same as in Figure 2. The synthetic-oversampling model produces less-biased predictions for sources with [Fe/H]﹩{}_{\mathrm{SSPP}}\lesssim -2.0,﹩ than the regression models in Section 4. However, the reduction in bias comes at the cost of RMSE and CER. Note that the results shown here are for CV on the full 170,610 source training set, meaning the SVM-regression results are slightly different than those shown in Figure 2.
Other Images in This Article
Copyright and Terms & Conditions
© 2015. The American Astronomical Society. All rights reserved.