Image Details
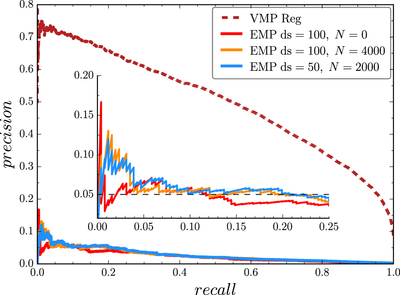
Caption: Figure 5.
Precision–recall curves for different parameters of the synthetic oversampling method. The baseline model, which features no oversampling (N = 0) or downsampling of the majority (ds = 100), is shown with a solid red line. The model with no downsampling and 40× oversampling is shown with a solid orange line, while the model with 50% downsampling (ds = 50) and 20× oversampling is shown with the light blue line. The use of synthetic EMP stars significantly improves the performance of the model. The zoom-in shows that the synthetic-oversampling method produces a FoM that is ∼2× better than the baseline model. These results are relatively insensitive to the degree of over- and downsampling (see Table 2). The maroon-dashed line shows the precision–recall curve when using the SVM regression model from Section 4 to identify VMP stars.
Other Images in This Article
Copyright and Terms & Conditions
© 2015. The American Astronomical Society. All rights reserved.