Image Details

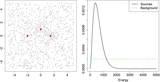
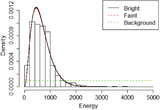
Caption: Figure 1.
Fitting gamma distributions to a counts spectrum. The histogram shows the observed spectrum of the brightest of the Chandra sources in the Orion field in Section 7.2 (from one iteration of our algorithm; see Section 4.3), and the curves show gamma model fits. The solid line (green) is the extended full model fit of the two-gamma spectral model and the dashed line (red) is the maximum likelihood fit of the one-gamma model.
Other Images in This Article

Show More
Copyright and Terms & Conditions
© 2015. The American Astronomical Society. All rights reserved.
Copyright ©
2024 Astronomy Image Explorer. All Rights Reserved.