Image Details

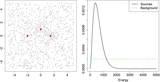
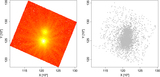
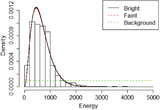
Caption: Figure 4.
Simulated data set for the 10 source case. The simulated spatial counts distribution (left) and the adopted spectra for each source and the background (right) are shown. The true locations of the 10 sources are marked by large (red) dots in the left plot.
Other Images in This Article

Show More
Copyright and Terms & Conditions
© 2015. The American Astronomical Society. All rights reserved.
Copyright ©
2024 Astronomy Image Explorer. All Rights Reserved.