Image Details

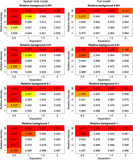
Caption: Figure 5.
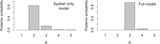
Average posterior probabilities of plausible values of ﹩K﹩ across ten data sets. Left plots show posteriors for the ten-source reality (﹩{K}_{{\rm{true}}}=10﹩) with prior mean values of ﹩\kappa =1,3,10﹩ from top to bottom. Right plots show posteriors for the one-source reality (﹩{K}_{{\rm{true}}}=1﹩) with ﹩\kappa =1,3,10﹩. In each plot, the 25% and 75% quantiles across the 10 data sets are indicated by the vertical error bars for each value of ﹩K﹩.
Other Images in This Article

Show More
Copyright and Terms & Conditions
© 2015. The American Astronomical Society. All rights reserved.
Copyright ©
2024 Astronomy Image Explorer. All Rights Reserved.