Image Details

Caption: Figure 9.
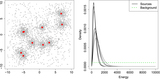
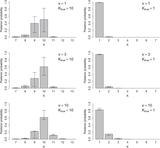
Histogram of the spectral data in the XMM observation of FK Aqr and FL Aqr. Plotted are 1000 spectra for the bright (solid black lines) and faint (dashed red lines) sources, each corresponds to a posterior sample of the spectral parameters. (The posterior variance is small on this scale.) The background spectra is shown by the dotted green line.
Other Images in This Article

Show More
Copyright and Terms & Conditions
© 2015. The American Astronomical Society. All rights reserved.
Copyright ©
2024 Astronomy Image Explorer. All Rights Reserved.