Image Details

Caption: Figure 7.
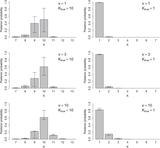
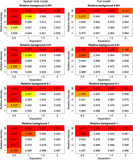
Sensitivity of location determination as a function of source separation, relative strength, and background level. The simulation is the same as that in Figure 6. Mean posterior locations of two sources for each of 100 simulations, under the spatial-only model (top 20 plots) and the full model (bottom 20 plots). Red and blue dots give the mean posterior locations for each simulation of the bright and faint sources, respectively. The large “X”s of corresponding color indicate the true locations. The diameters of the dots are proportional to the posterior probabilities of two sources. The relative background, relative source intensity, and source separation are indicated by b, r, and d, respectively.
Other Images in This Article

Show More
Copyright and Terms & Conditions
© 2015. The American Astronomical Society. All rights reserved.