Image Details
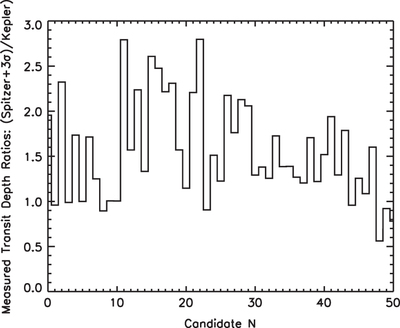
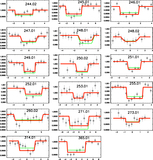
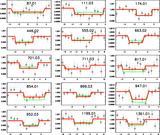
Caption: Figure 13.
Ratios of the transit depths measured from the Spitzer 4.5 μm light curves (﹩+3\sigma ﹩) to the transit depths measured in the Kepler bandpass for 50 KOIs targeted in this program. The KOIs are ordered similarly to Figure 12: increasing transit depths from Kepler toward the right.
Other Images in This Article
Show More
Copyright and Terms & Conditions
© 2015. The American Astronomical Society. All rights reserved.
Copyright ©
2025 Astronomy Image Explorer. All Rights Reserved.