Image Details
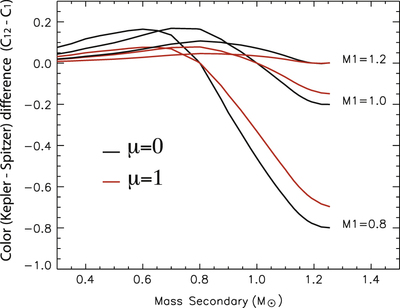
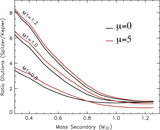
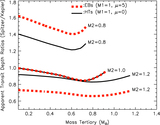
Caption: Figure 9.
Color (Kepler–Spitzer) difference between the combination of the two stars (primary and secondary) as a function of the mass M2 of the secondary. The calculations are presented for three mass scenarios for the primary star. The black curves represent the color differences for a secondary star equidistant to the primary (HT scenario), and the red curves are for a background secondary at a distance modulus from the primary corresponding to 1 mag.
Other Images in This Article
Show More
Copyright and Terms & Conditions
© 2015. The American Astronomical Society. All rights reserved.
Copyright ©
2025 Astronomy Image Explorer. All Rights Reserved.