Image Details
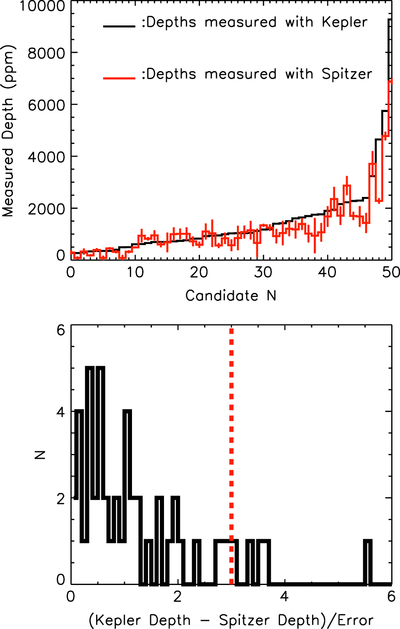
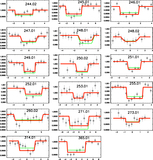
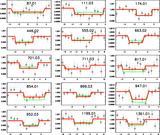
Caption: Figure 12.
Top: transit depths measured from the Spitzer 4.5 μm light curves (red histogram) compared to their depths measured in the Kepler bandpass (black histogram) for 50 KOIs targeted in this program. The error bars on the Spitzer measurements correspond to ﹩1\sigma ﹩ uncertainties. The targets are ordered by increasing transit depths measured from Kepler toward the right. Bottom: distribution of the significance of the apparent transit depth differences measured between Kepler and Spitzer. The vertical dotted red line highlights the ﹩3\sigma ﹩ uncertainties; it encompasses 85% of the candidates. Two KOIs with differences greater than ﹩6\sigma ﹩ do not appear on this figure (KOI-12.01 and 13.01). The difference in the apparent transit depths is not corrected for dilution caused by the presence of a close-by companion.
Other Images in This Article
Show More
Copyright and Terms & Conditions
© 2015. The American Astronomical Society. All rights reserved.